The total worldwide annual primary energy consumption in 2008 was 435 quadrillion according to current Energy Production Statistics.
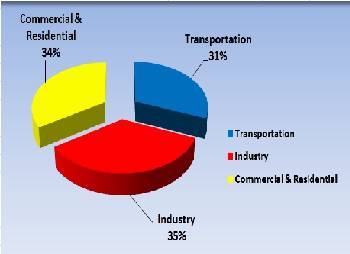
BTUs and over 110 quadrillions BTUs in the United States of America. Approximately 40 percent of the total primary energy is used in generating electricity. Of that, nearly 70 percent of the energy used in private homes and offices is in the form of electricity. 850 GW of electrical generating capacity is now installed in the U.S.A. to meet this demand. For most of this century, America’s electric demand has increased with the gross national product (GNP). At this rate, the U.S. will need to install additional 200 GW capacities by the year 2020.
In many parts of the world, the decision for new capacity installation decisions today is becoming more and more complicated because of difficulties in finding sites for a new generation and transmission facilities of any kind. Alternatives to nuclear and fossil fuel power are renewable energy technologies (ocean, solar, wind, hydro, geothermal and biomass). It has become increasingly difficult to carry through large-scale hydroelectric projects because of competing use of land and water. Existing hydro plants’ re-licensing requirements may even lead to the removal of some dams to protect or restore wildlife habitats. Among other renewable power sources, wind and solar has recently experienced rapid growth around the world. Having a wide geographical spread, they can be generated near the load centers, thus simultaneously eliminating the need for high voltage transmission lines running through rural and urban landscapes.
Globally, many countries offer incentives and guaranteed prices for renewable power. Under such incentives, the growth rate of wind power in Germany and India have been phenomenal.
Energy Production Statistics – Utility Perspective
Until the early 1990s, the interest in renewable energy was confined primarily among private investors. However, as the considerations of fuel diversity, environmental concerns and market uncertainties are becoming important factors in today’s electric utility resource planning, renewable energy technologies found their place in the utility resource portfolio.
Wind and solar power, in particular, have the following advantages to electric utilities:
• Wind and Solar power are highly modular as their capacity can be increased incrementally to match with gradual load growth.
• Construction lead time is significantly shorter than those of the conventional plants, thus reducing the financial and regulatory risks.
• They bring diverse fuel sources that are free of cost and free of pollution. Because of these benefits, many utilities and regulatory bodies are increasingly interested in acquiring hands-on experience with renewable energy technologies in order to plan effectively for the future.
Energy Production Statistics – Modularity
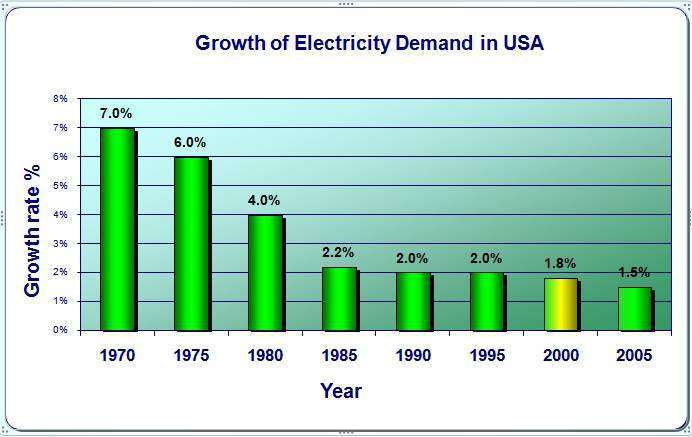
The electricity demand in the U.S.A. grew at 6 to 7 percent until the late 1970s, tapering to just 1.5 percent in 2005. The 7 percent growth rate of the 1970s meant doubling the electrical energy demand and the installed capacity every 10 years. The decline in the growth rate since then has come partly from the improved efficiency in electricity utilization through programs funded by the U.S. Department of Energy. The small growth rate of the 1990s is expected to continue well into the next century.
The economic size of conventional power plants has been 500 MW to 1,000 MW capacity. These sizes could be justified in the past, as the entire power plant of that size, once built, would be fully loaded in just a few years. At a 2 percent growth rate, however, it could take decades before a 500 MW plant could be fully loaded after it is commissioned in service. Utilities are unwilling to take such long-term risks in making investment decisions. This has created a strong need for modularity in today’s power generation industry. Both wind and solar photovoltaic power are highly modular. They allow installations in stages as needed without losing the economy of size in the first installation. The photovoltaic (PV) is even more modular than the wind. It can be sized to any capacity, as the solar arrays are priced directly by the peak generating capacity in watts and indirectly by the square foot.
The wind power is modular within the granularity of the turbine size. Standard wind turbines come in different sizes ranging from tens of kW to hundreds of kW. Prototypes of a few MW wind turbines had been successfully tested and are widely commercially available in Europe. For utility-scale installations, standard wind turbines in the recent past have been around 500-1000 kW, but are now in the 1000-1,500 kW range. A large plant consists of the required number and size of wind turbines for the initially needed capacity. More towers are added as needed in the future with no loss of economy. In developing countries such as China or India, the demand has been rising at a 10 percent growth rate or more. This growth rate, when viewed with the large population base, makes these two countries rapidly growing electrical power markets for all sources of electrical energy, including renewables.
Emission-Free
In 2008, the U.S.A. produced over 3 trillion kWh of electricity, 70 percent of it (2 trillion kWh) from fossil fuels, a majority of that came from coal. The resulting emission is estimated to be 2 billion tons of CO2, 15 million tons of SO2 and 6 million tons of NOx. The health effects of these emissions are of significant concern to the U.S. public. The electromagnetic field emission around the high voltage transmission lines is another concern that has also recently become an environmental issue.


