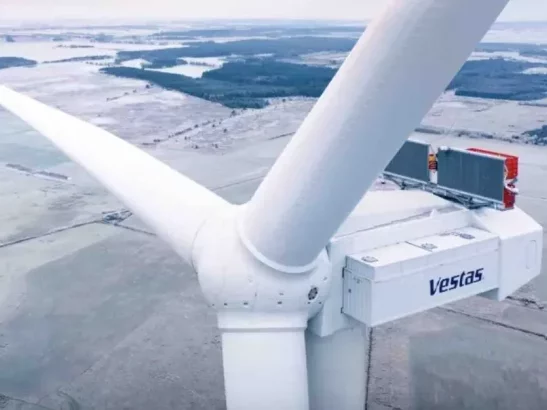
Since time immemorial poets, writers, philosophers have posed the question “Who has seen the wind?”. While the effects of the wind can clearly be seen, on clouds, smoke and wind farm turbine blades, the pure wind itself is much more elusive to capture visually. However, two people described as “technology artists” have produced a stunning moving video visualization of the wind across the United States. It was part of Google’s “Big Picture” visualization research group and the artists, Fernanda Viegas and Martin Wattenberg have created a truly astonishing and moving picture of the energy that we cannot see, but we can feel and harness as renewable energy, usually benign but sometimes angry and destructive, the wind has seldom been out of the news in recent months.
The artists themselves put it well when they said:
“An invisible, ancient source of energy surrounds us–energy that powered the first explorations of the world and that may be a key to the future. This map shows you the delicate tracery of wind flowing over the US right now.”

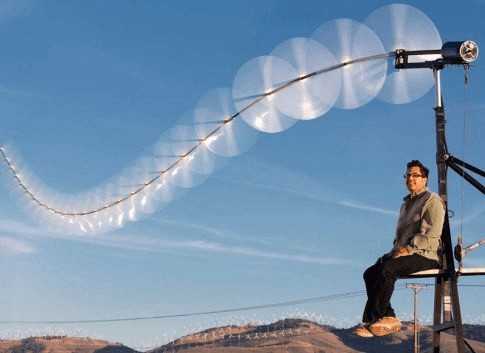
The live map is simply named “Wind Map” and displays streaks that indicate the varying wind speeds from between 1 and 30 miles per hour. The denser the white streaks, the stronger the winds. It’s fascinating to watch and you’ll notice certain common occurrences such as the dramatic swirls around the Rockies and strong winds blowing off of the five Great Lakes.

The information they have gathered is taken from the US National Digital Forecast Database, which is factored into the wind map once an hour, meaning, to all intents and purposes, what you see on the map is real wind now! Just ignore those people who say that the wind map looks like an upside-down hanging woolly mammoth or a distressed poodle!
The artists said that they would like to develop a world-wind map, but at present, there isn’t a global source of live wind data.
In a similar project, NASA recently created a visualization of sea currents from data collected over a 24 month period: